The True Cost of Dispensary Labor: A Sales-Per-Hour Breakdown
In short: Labor cost percentage tells you the size of your labor bill; sales-per-labor-hour tells you whether it’s actually producing. Under 280E, the gap between the two is more expensive in cannabis than in any other retail. This breakdown shows how to read SPLH across stores and shifts — and what it surfaces when POS sales and payroll hours live in the same warehouse.
Most dispensary operators track labor as a line on the P&L and move on. That’s the mistake. Labor is one of the only large costs you fully control week to week — and in cannabis, it’s also one you mostly can’t deduct. Under IRS Section 280E, plant-touching retailers are barred from writing off ordinary operating expenses, which means a large share of your retail payroll hits the bottom line at full, pre-tax weight. A wasted labor dollar in a dispensary doesn’t cost you a dollar. It can cost you a dollar plus the tax you’d have saved if you were any other kind of retailer.
So “what does labor cost?” is the wrong question. The right one is: what is each labor hour actually producing? That’s where sales-per-labor-hour comes in — and it’s the single metric that works whether you’re a CFO looking at forty stores or a manager building next week’s schedule for one.
What sales-per-labor-hour (SPLH) actually measures
Sales-per-labor-hour is exactly what it sounds like:
SPLH = Net Sales ÷ Total Labor Hours Worked
If a store does $48,000 in net sales in a week on 600 total labor hours, its SPLH is $80. That number is far more honest than “labor was 24% of revenue,” because the percentage hides when and where the inefficiency lives. Two stores can both run labor at 24% of revenue and have completely different problems — one is overstaffed on slow weekday mornings, the other is understaffed at Friday peak and leaving baskets at the door.
Labor cost percentage tells you the size of the cost. SPLH tells you the productivity of the cost. You need both, but operators who only watch the percentage are flying with half the instrument panel.
A useful frame: labor cost percentage is the rearview mirror your accountant reviews monthly. SPLH is the gauge a manager should be able to read by shift.
The two numbers most operators never connect
Here’s the uncomfortable part. Almost every dispensary already owns both halves of this equation — and almost none of them are joined.
Your sales data lives in your POS and eCommerce platform (Dutchie, Treez, and so on): transactions, baskets, hourly revenue, by store. Your labor data lives in payroll and scheduling: hours worked, wage rates, overtime, by employee, by shift. Each system is excellent at its own job. Neither was built to answer the question that actually drives profit: how much revenue did each labor hour generate, by store, by day-part, by person?
To get SPLH today, most teams export both, drop them into a spreadsheet, manually align the date ranges, and rebuild the report every week. It’s slow, it breaks, and it’s exactly the kind of manual reconciliation that quietly stops happening the moment things get busy. The metric that should be reviewed weekly ends up calculated quarterly, if at all — usually after a bad month has already closed.
Why this hits cannabis harder than ordinary retail
In conventional retail, sloppy labor scheduling is a margin problem. In cannabis, 280E turns it into a tax-amplified margin problem.
Because most retail payroll can’t be deducted, every hour of slack labor is paid for with after-tax dollars at an effective rate that, for many plant-touching operators, runs well above a normal corporate rate. The general retail benchmark of keeping labor under roughly 30% of revenue is a floor, not a target — cannabis operators who run lean tend to land meaningfully lower. And the swing is not trivial: on a $4 million store, the gap between a 26% labor ratio and a 22% labor ratio is about $160,000 a year. That’s straight arithmetic, before you even account for the 280E penalty on the wasted portion.
The point isn’t to understaff. Cut coverage at peak and you bleed conversion and basket size, which costs more than the labor you saved. The point is to staff to actual demand — and you can’t do that until you can see SPLH by day-part across your stores. Operators who schedule against real transaction patterns rather than uniform daily coverage routinely pull two to four points of labor cost out without touching customer experience. That’s the prize. The blocker is almost always data, not effort.
The fix: stop reconciling, start reporting
This is the gap CannaHub was built to close.
CannaHub is a managed data warehouse for cannabis operators. We centralize your data — POS and eCommerce sales, inventory, compliance, and your payroll and labor hours — into one governed source of truth, and we build personalized reporting on top of it. You don’t get a generic dashboard you have to bend your business around. You get the reports your operation actually runs on, built against your data, refreshed automatically.
Because the sales side and the labor side live in the same warehouse, SPLH stops being a Sunday-night spreadsheet exercise and becomes a standing report. Joining the two data sources lets you finally see:
- SPLH by store, by day, by day-part — so you know whether Tuesday at 10am is overstaffed and Friday at 5pm is underwater, per location.
- Labor cost percentage and SPLH side by side — the size and the productivity of the cost, on one report.
- Productivity by team member — revenue per labor hour at the budtender level, the basis for fair, data-backed scheduling and incentive design.
- Cross-store benchmarking — the same metric, defined identically, rolled up so leadership compares stores on a level field instead of arguing about whose spreadsheet is right.
One warehouse, one joined view, one definition of the number. That’s the whole idea.
What the report actually surfaces
Here’s a real slice from a CannaHub Hourly Sales and Labor report, joining a dispensary’s Dutchie POS sales to its payroll hours and cost. Look at one holiday week — same staffing pattern, very different outcomes:
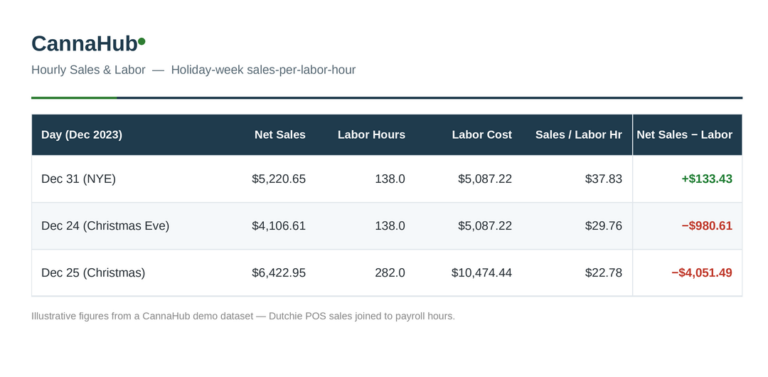
Two of the three days, the store paid more for labor than it sold. On Christmas, it staffed 282 labor hours against $6,423 in sales — sales-per-labor-hour collapsed to $22.78, and the day lost over $4,000 on labor alone, before product cost, rent, or 280E. New Year’s Eve ran the same 138-hour pattern as Christmas Eve but cleared a small profit, because demand actually showed up.
Holiday weeks are exactly when this bites: extra coverage gets scheduled for a rush that doesn’t arrive evenly, so they’re the sharpest test of whether staffing tracks demand. But the same gap shows up on any over-covered Tuesday morning — the holiday just makes it loud enough to see. Once you can read SPLH by day-part, you catch the quiet version too.
Now notice what a monthly labor-cost-percentage average would have done to this: it would have blended these days into the mean and hidden every one of them. The report doesn’t tell you Christmas was a mistake — maybe it was holiday pay, maybe it was a genuine overstaff. It tells you exactly where to look, the day after, instead of the quarter after. That’s the difference between a metric you react to and a metric you steer with.
What it looks like at each altitude
If you’re a CFO or multi-unit operator: You get labor productivity as a portfolio metric. SPLH and labor cost percentage become directly comparable across every location because they’re defined once, in the warehouse, against a single source of truth — no more reconciling four managers’ four definitions of “labor cost.” That’s the input to four-wall profitability, to staffing-model decisions, and to spotting which stores deserve more headcount and which need a hard look. And because the labor data is governed alongside the rest of your reporting, it’s audit-ready when 280E cost allocation questions come up.
If you’re a dispensary or chain manager: You get a number you can actually act on before the shift, not a verdict after the month closes. See where your hours are producing and where they’re idle, build next week’s schedule against real demand curves instead of gut feel, and walk into your review with the productivity story already told.
Same metric. Same data. Different altitude. That’s why SPLH is the right backbone for a labor conversation that has to satisfy both the corner office and the sales floor.
Frequently asked questions
Divide net sales by total labor hours worked for the same period: SPLH = Net Sales ÷ Labor Hours. A store doing $48,000 in net sales on 600 labor hours has an SPLH of $80. Run it by store, by day, and by day-part to see where hours are productive and where they’re idle.
There’s no universal number, because SPLH scales with your average order value, price points, and market. Instead of chasing someone else’s benchmark, back into your own: divide your fully loaded labor cost per hour by your target labor-cost percentage. If your loaded cost is $25/hour and you want labor at 20% of revenue, your SPLH target is about $125. Track your trend against that target, not against a national average that doesn’t share your price structure.
A common retail guideline is to keep labor under roughly 30% of revenue, and lean cannabis operators often run meaningfully lower, in the low-to-mid 20s. But the percentage is a ceiling, not a strategy — two stores at the same percentage can have very different problems. Pair it with SPLH so you see both the size of the cost and whether it’s actually producing.
Under IRS Section 280E, plant-touching cannabis businesses can’t deduct most ordinary operating expenses, so a large share of retail payroll is paid with after-tax dollars. That means wasted labor hours cost more in a dispensary than in conventional retail — the same scheduling slack carries a tax penalty on top of the wage. It’s why labor discipline is a bigger profit lever in cannabis than the headline numbers suggest.
Staff to actual demand rather than uniform daily coverage. Operators who schedule against real transaction patterns by hour and day typically pull a few points of labor cost out without hurting the customer experience. The prerequisite is visibility: you need SPLH by day-part to know which shifts are over-covered and which are leaving sales at the door.
Your sales data lives in your POS and the labor data lives in payroll, so the hourly view usually requires joining the two. Either rebuild it manually in a spreadsheet each week, or centralize both sources in a managed data warehouse so the report refreshes on its own. CannaHub takes the second route — joining POS sales to payroll hours so SPLH is a standing report instead of a recurring chore.
The takeaway
Labor isn’t just a cost to minimize — it’s a cost to make productive, and in cannabis the tax code raises the stakes on getting it right. Sales-per-labor-hour is the metric that exposes the real number. The only reason most operators don’t run it weekly is that their sales data and their labor data live in separate systems that were never designed to talk.
CannaHub closes that gap: we centralize your POS sales and your payroll data in one managed warehouse and build the reporting on top of it, so SPLH becomes something you watch — not something you rebuild from scratch every week.