
Cannabis Sell-Through Reporting Across Multiple Backends, Without the Manual Rebuild
In short: Sell-through is the only core retail metric whose numerator and denominator live in different systems. Units sold come from your POS; units produced or received come from cultivation, manufacturing, or seed-to-sale. For a vertically integrated operator, that split is why the report gets rebuilt by hand every month — and why it’s usually stale by the time anyone reads it.
Your sell-through report isn’t late because your analyst is slow. It’s late because you asked a question that no single system in your stack can answer, and the only way to answer it today is to export from three or four platforms and match SKUs by hand.
Revenue lives in the POS. Labor lives in the POS. Basket size, discount rate, transaction count — one system, one export, one refresh. But a cannabis sell-through report needs units sold from retail and units produced or received from the other end of your own supply chain. If your grow runs on one platform, your kitchen on another, distribution on a third, and each state’s dispensaries on whatever POS came with the acquisition, sell-through isn’t a report. It’s a reconciliation project that restarts every period.
Here’s what it actually measures, why it structurally breaks for vertically integrated operators, why the stakes went up in 2026, and what it takes to stop rebuilding it.
What a cannabis sell-through report actually measures
Sell-through rate is the share of available inventory that sold in a given window. The standard formula is straightforward:
Sell-Through Rate = (Units Sold ÷ Units Received) × 100
Some operators use units on hand at the start of the period instead of units received. Either is defensible — pick one and hold it constant, because the two produce different numbers and mixing them mid-year is how a trend line becomes a rumor.
Across general retail, published guidance puts a healthy sell-through rate in the 70–80% range, with 80–90% considered strong and anything above 90% flagged as a stockout risk rather than a win. Below roughly 40% signals something wrong with the buy, the price, or the placement. Those are apparel-and-hardgoods numbers, not cannabis numbers — there is no reliable published cannabis benchmark, and you should be suspicious of anyone who quotes you one. Derive your own: take four quarters of your own history, calculate sell-through by category at a fixed interval, and set the target at your own top-quartile performance.
Sell-through is also not inventory turnover, though the two get used interchangeably. Turnover counts how many times you cycle inventory over a period. Sell-through is a snapshot of what moved out of what you had. Turnover describes the year; sell-through describes this batch, while you can still do something about it.
Why the report breaks: the numerator and denominator live in different systems
Here is the structural problem, stated plainly. Every other operational metric is contained. Sell-through is not.
The numerator — units sold — is a POS fact, recorded in retail SKUs at whatever grain the store’s system uses, on the store’s clock.
The denominator — units received or produced — is a supply-chain fact, arriving as Metrc package tags, transfer manifests, batch records, or ERP receipts: package grain rather than unit grain, often grams rather than eaches.
Getting those to agree requires a mapping nobody owns — this batch became these packages, split into these SKUs, sold under these POS item names. Compliance systems track packages through the chain; retail systems track items across the counter. Sell-through lives in the seam. The mapping isn’t hard because the math is hard; it’s hard because it’s manual, undocumented, and living in one analyst’s spreadsheet.
Then multiply it. A different POS in each state. A cultivation platform that predates the retail acquisition. A manufacturing system chosen by a team that no longer works here. Each exports on its own schedule, in its own format, with its own definition of a “unit.” The rebuild isn’t a failure of discipline — it’s the predictable cost of asking a cross-system question with single-system tools.
Why sell-through carries more weight in cannabis than in general retail
Three amplifiers make a slow sell-through number more expensive here than it would be almost anywhere else.
The product depreciates on the shelf. Flower is a perishable agricultural good with a regulated freshness window — Colorado, for instance, caps use-by dates on inhaled products at no more than nine months from harvest or production unless shelf-stability testing supports longer, and storage guidance references the ASTM D8197 water-activity range of 0.55–0.65 aw for dry flower. Slow-moving product doesn’t just tie up capital; it degrades toward a markdown you’ll be forced to take.
Price compression means you can’t wait it out. In mature markets, a slow SKU’s price is likelier to fall than rise while it sits. Time isn’t neutral here — it’s a discount you haven’t booked yet.
And as of 2026, tax treatment depends on which channel the product sold through. A Justice Department final order signed April 22, 2026 and announced the next day — published and effective April 28 — moved marijuana in FDA-approved drug products and marijuana under a state medical marijuana license from Schedule I to Schedule III. Adult-use marijuana was explicitly not covered and remains Schedule I, so Section 280E continues to apply in full force to adult-use activity. DEA’s broader rescheduling hearing ran June 29 through July 15, 2026, with post-hearing briefs due August 17; no recommended decision has issued, the ALJ’s eventual recommendation is non-binding on the Administrator, and the April order is under consolidated challenge in the D.C. Circuit. The split is the operating reality for now.
For a hybrid medical and adult-use operator, that turns a reporting problem into a tax problem. Treasury and the IRS have announced that 280E guidance is coming and signaled that expenses may need apportioning between trafficking and non-trafficking activity — but that guidance is not published yet, and practitioners are advising operators to choose a defensible method now and document it. Every method currently on the table, from revenue split to square footage to headcount hours, rests on knowing which product moved through which channel, in what quantity, at what price. If your medical and adult-use activity sit in different systems, you cannot produce that cleanly. The report you’ve been rebuilding by hand is now load-bearing.
The fix: one warehouse underneath every backend
You don’t fix a cross-system metric with a better spreadsheet, and you don’t fix it by ripping out four platforms to standardize on one — that’s a multi-year project that stalls the moment you acquire your next license. You fix it by putting a layer underneath the systems you already run.
CannaHub is a centralized data warehouse for cannabis operators, built to unify and automate operational, compliance, and financial data across your existing stack into reports and dashboards — without forcing you to replace the platforms your teams already use. For sell-through specifically, that means:
- Both halves of the formula land in the same place. POS sales, seed-to-sale package data, and production or receipt records are pulled into one warehouse on a schedule, not by export.
- The SKU-to-batch mapping becomes infrastructure, not tribal knowledge. Defined once, applied every run, and auditable when someone asks how a number was derived.
- Metrc data is a first-class input, so the compliance record and the sales record are reconciled against each other instead of side by side in two browser tabs.
- One definition of “unit” and one calendar across every state and every backend, which is what makes cross-market comparison honest.
- The report runs itself. Sell-through becomes a standing dashboard your team checks, not a deliverable someone assembles.
The point isn’t the dashboard. The point is that the question stops costing three days to answer.
What it looks like
A sell-through view for a vertical operator has to assemble each row from multiple systems. Units to retail comes from the transfer manifest, units sold from the POS, and days since packaging from the production record — three sources, one line:
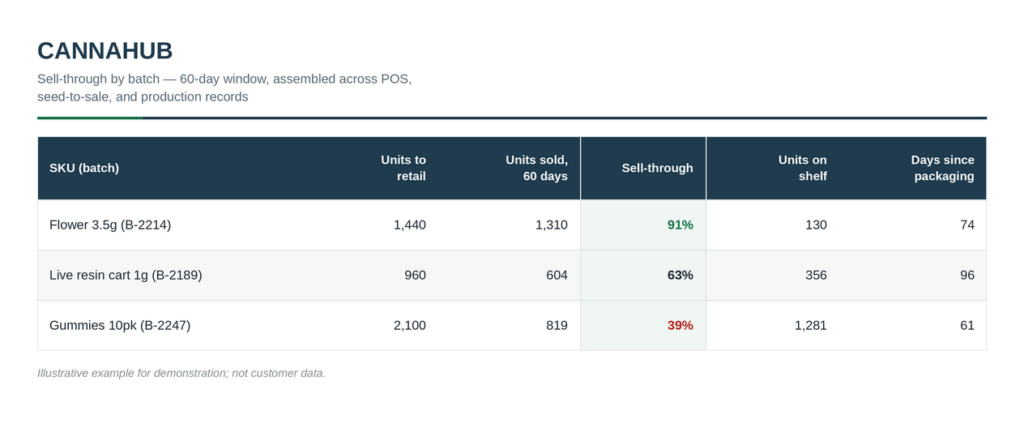
CannaHub cannabis sell-through report showing three batches with sell-through rate and days since packaging
Read it from the bottom up. The gummies look healthy on a revenue report — 819 units sold is real money, and nobody flags a SKU that’s selling. But 1,281 units are still sitting, sell-through is under the 40% line general retail treats as a warning, and the clock started 61 days ago. That’s a markdown forming in slow motion, and the revenue report will never show it to you.
The flower at 91% is the opposite failure. It reads like a win, but at that rate you were almost certainly out of stock before the batch cycled — you didn’t sell 1,310 units, you sold everything you had and turned away demand you can’t measure. Both rows are problems. Neither is visible without the denominator.
The obvious objection is fair: categories turn at different speeds, so one threshold across flower, vape, and edibles is crude. Correct — which is why the target comes from your own category history, not a borrowed benchmark. The threshold starts the conversation; the trend against your own baseline is the signal.
The same report at each altitude
If you’re the CFO or COO of a multi-state operation, sell-through by category by market is your early-warning system for working capital — and the same underlying data feeds the 280E apportionment you’ll have to defend. It tells you where cash is trapped, which markets are buying ahead of demand, and which product moved through which channel, before anyone asks you to prove it.
If you’re running a single facility or store, the same number answers a smaller and more immediate question: what do I stop reordering, what do I discount now while it’s still worth something, and what do I need more of before the weekend?
Same metric, different altitude — which is precisely why it’s worth the infrastructure to compute it once, correctly, for everybody.
Frequently asked questions
Divide units sold in the period by units received in that period, then multiply by 100. Some operators use units on hand at the start of the period as the denominator instead. Both are valid; pick one, document it, and never switch mid-year.
There’s no reliable published cannabis-specific benchmark, and you should treat any single quoted figure with suspicion. General retail guidance puts a healthy rate around 70–80%, with under 40% signaling a problem and over 90% signaling stockouts. Derive your own target from four quarters of your own category-level history.
Sell-through is a snapshot — of the inventory you had available, what percentage sold in this window. Turnover is a rate — how many times you cycled your full inventory over a longer period. Sell-through catches a specific batch going stale; turnover describes the year in aggregate.
Because the two halves of the formula sit in different systems and at different grain. Sales are POS items; supply is Metrc packages, transfer manifests, and batch records measured in grams. Vertically integrated and multi-state operators often run different platforms per function and per state, so a single report can require four exports and a hand-built SKU-to-batch mapping.
Partially. The April 2026 final order moved FDA-approved marijuana drug products and state-licensed medical marijuana to Schedule III; adult-use marijuana was not included and remains Schedule I, so 280E continues to apply to adult-use activity. Treasury has announced that apportionment guidance is coming for hybrid operators but has not published it, so most practitioners are advising a documented, defensible method in the meantime. This is general information, not tax advice — confirm your position with your cannabis CPA.
Monthly is the common cadence, but monthly is a lagging view for perishable categories. If your data is automated rather than assembled, weekly by category and batch gives you enough runway to act while a markdown is still avoidable — which is the entire argument for not rebuilding it by hand.
The takeaway
Sell-through is the metric that exposes your data architecture, because it’s the one question that refuses to stay inside a single system. Every month your team rebuilds it by hand, you pay an infrastructure tax in analyst hours — and get an answer that’s already old, that nobody fully trusts, and that now has to hold up to a 280E allocation review.
The fix isn’t more reporting discipline or a consolidation project you can’t afford to run. It’s a warehouse underneath the backends you already have, where units sold and units produced sit in the same place, mapped once, refreshed on a schedule. That’s what turns sell-through from a project into a number you simply look at.