How to Read Your Dutchie Reports (And What They Don't Tell You)
In short: Dutchie reports are excellent at answering “what did we sell yesterday” and quietly useless at answering “why is our margin slipping.” The dashboards show you totals; they rarely show you the rate, the trend, or the leak. This guide walks through the reports operators actually open — Sales Closing, Vendor Spending, Day of Week — then names the four blind spots that live in the gaps between them.
If you run a dispensary on Dutchie, you already know the reports are clean, fast, and genuinely good at their job. That’s exactly why they’re dangerous. A report that looks complete stops you from asking whether it’s telling you the whole story — and the Dutchie reports you open every morning are built to close the day, not to explain it. They tell you what happened. They almost never tell you why, and they go silent on the three questions that actually move your P&L: What’s the trend? What’s it doing across all my stores? And what’s left after 280E?
This is not a knock on Dutchie. It’s the difference between a point-of-sale reporting layer and an analytics layer, and most operators don’t realize they’ve been treating the first as if it were the second. Let’s read the reports the way they’re meant to be read — and then look at where they stop.
Start with the three reports that matter
Most of the value in your Dutchie reports lives in three views, so learn to read them in this order.
Sales Closing is your daily P&L snapshot. Read the columns as a chain: gross sales, minus discounts and returns, equals net; net minus cost equals profit. The pie splitting net sales into Cost and Profit is really your gross margin drawn as a picture. If your Profit slice sits around 55–57%, you’re inside the healthy band for a limited-license market — cannabis dispensary gross margins typically run 45–55%, with strong limited-license operators reaching the high 50s to low 60s.
Vendor Spending by Category is your purchasing mirror — quantity purchased and extended cost by vendor and category. This is where you catch the vendors you’re over-indexed on and the categories where average unit cost is drifting up. Flower usually dominates quantity but carries the thinnest margin (roughly 15–25%), while edibles and accessories carry 50–70%. If your buying skews to the low-margin end, this report shows it first.
Day of Week Net Sales is your staffing and promotion map. When the bars are nearly flat — as they often are — that’s a signal, not a non-event: demand isn’t concentrated the way you assumed, and your staffing or discount calendar may be built around a pattern that doesn’t exist.
Read together, these three answer “what sold, what we paid, and when.” That’s a solid day’s picture. Now here’s where the picture ends.
Blind spot #1: the total row can lie to you
Open any Dutchie report with a rollup and look at the bold total line. On one real Sales Closing export, the daily Average Cart values were a believable $79 to $105 — and the grand-total “Avg Cart Amt” read $25,458.33.
Nobody’s basket is twenty-five thousand dollars. That figure is a rollup artifact: an average of averages landing in a field that should never be summed. It’s harmless if you notice it and quietly catastrophic if you paste it into a board deck. The lesson generalizes: a total row is only trustworthy for values that add (gross, net, cost, transactions). The moment a column is a rate or an average — cart size, margin percent, discount percent — the total row is where reports go to mislead. Dutchie won’t warn you which is which. You have to know.
Blind spot #2: discounts are shown as dollars, never as a rate
Here’s the gap that costs the most. Dutchie’s Sales Closing report shows a Disc Amt column in dollars. What it doesn’t show — and what quietly decides your margin — is discount percentage, day over day. Take five consecutive days from a single Ohio operator’s export:
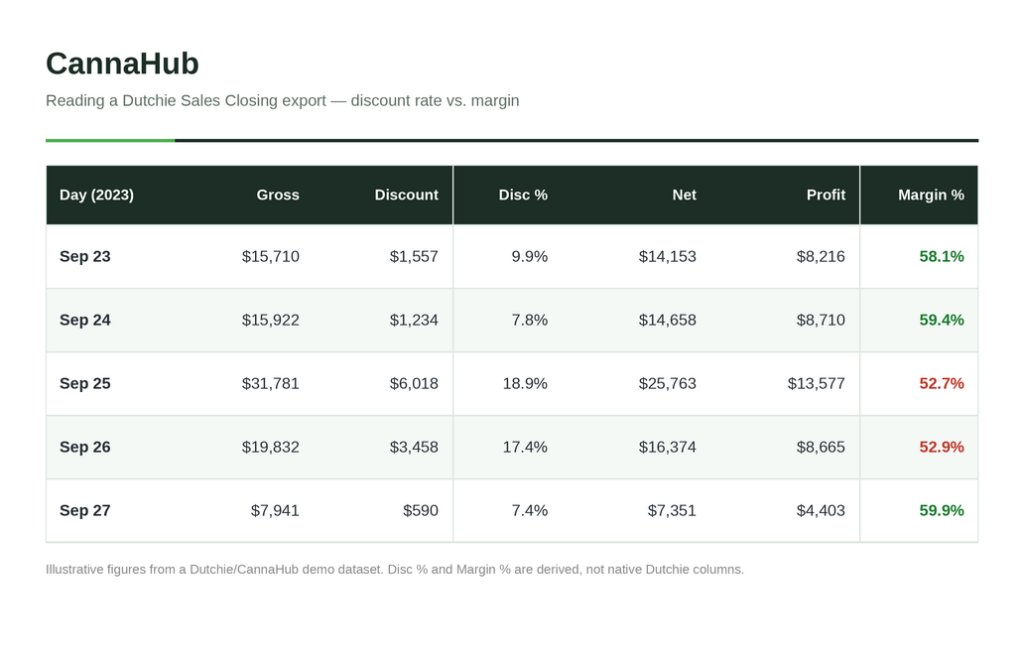
Read the two derived columns together and the leak is obvious: on the days discounting climbed to 17–19%, gross margin fell to about 53%; on the days discounting sat near 7–8%, margin held near 59–60%. That’s a 6- to 7-point margin swing driven by promotion intensity — and neither the Discount % nor the Margin % column exists in the native report. You get the dollars. You have to do the division yourself, every day, to see it.
The obvious objection is that Sep 25 was the biggest sales day, so of course discounts were higher. That’s precisely the point: the report celebrates the top line ($31,781 gross!) while burying the fact that the day earned its worst margin. High-volume, deep-discount days feel like wins on the dashboard and read like leaks on the spreadsheet. Without the rate, you can’t tell the two apart.
Blind spot #3: one store at a time, one moment at a time
Every Dutchie report is scoped to a location and a window. That’s fine until you run more than one store or want to compare this September to last September. Then you hit two walls at once.
The first is consolidation. Multi-location operators end up exporting each store’s reports and reconciling them by hand, because native reporting doesn’t give a clean, apples-to-apples rollup across locations with per-store detail underneath. Vertically integrated operators feel this hardest — retail, wholesale, cultivation, and compliance data live in separate places, and stitching them together is manual work measured in hours per week.
The second is history. POS reporting is built to close the current period, not to be your system of record for the last three years. Trending year-over-year, keeping granular transaction history after a migration, or rebuilding a period from before a platform change — these are the moments operators discover their “reporting” was really a live view, not an archive. Dutchie’s own consolidation of acquired platforms like Greenbits and LeafLogix has made historical continuity a real pain point for some legacy users.
Blind spot #4: the number Dutchie shows isn’t the number you keep
Every profit figure in your Dutchie reports is a gross profit — net sales minus product cost. It is not what you keep, because it hasn’t met 280E.
Under IRS Section 280E, a dispensary can subtract cost of goods sold but cannot deduct ordinary operating expenses — budtender wages, rent, security, marketing, even the POS software itself. Because retail dispensaries can only classify roughly 35–50% of total expenses as COGS, they carry the heaviest effective tax burden of any cannabis business: a store doing $5M in revenue with $2M COGS and $2M of operating expenses can face an effective federal rate around 70%, versus about 21% for a comparable non-cannabis business. The “Profit” column in Sales Closing is the number before that reality lands. Read on its own, it flatters you.
The fix: put the reports on top of a warehouse, not inside the POS
The pattern across all four blind spots is the same: the data is fine, but it’s trapped in the reporting layer of a system built to run a register, not to analyze a business. The answer isn’t to abandon Dutchie — it’s to stop asking Dutchie to be your analytics platform.
CannaHub is a managed data warehouse and reporting layer for cannabis operators. It pulls your Dutchie data (and your other systems) into one governed warehouse and builds reporting on top, so the questions the native dashboards can’t answer become standing reports:
- Rates, not just dollars. Discount % and margin % by day, store, category, and budtender — calculated and trended, so a margin leak surfaces the day it starts instead of at month-end.
- Every store in one view. Consolidated across locations with per-store detail underneath, no manual reconciliation, no averaging-the-averages artifacts.
- Real history. A true system of record that survives migrations and platform changes, so year-over-year and multi-year trends are one click, not an archaeology project.
- 280E-aware profit. Reporting that separates COGS from non-deductible operating expense, so the profit you look at is closer to the profit you keep.
Put simply: Dutchie tells you what happened today; CannaHub tells you what it means over time, across your footprint, and after tax.
At each altitude
If you’re a CFO or owner, the blind spots compound into a forecasting problem. Gross-profit optimism plus a 280E tax wall plus un-consolidated multi-store data is how a business that looks healthy on the dashboard misses on cash. You need the rate and the trend, warehoused and durable, not a screenshot from each store’s closing report.
If you’re a store manager, the same numbers are a daily lever. Discount % by day and by budtender tells you where margin is walking out the door this week, while there’s still time to coach it. Same metric, different altitude — the CFO reads it as risk, the manager reads it as a to-do list.
Frequently asked questions
Dutchie provides sales and closing reports, vendor and purchasing reports, inventory reports, and day-of-week and category breakdowns, among others. They’re strong for daily operational close and compliance, and thinner for trend analysis, cross-location consolidation, and long-term historical reporting.
Divide the Discount (Disc Amt) by Gross Amt for the same period, then multiply by 100. Do it per day rather than per month — the monthly average hides the high-discount days that are actually compressing your margin.
Because total rows sum every column, including ones that should never be summed. Dollar columns (gross, net, cost) add correctly; rate and average columns (average cart, margin %, discount %) become meaningless in the total row. Trust the totals for dollars, recompute the rates yourself.
Native reporting is scoped per location, so most multi-store operators export and reconcile by hand or move the data into a warehouse to get a clean rollup with per-store detail. This is one of the most common reasons operators add an analytics layer on top of Dutchie.
No. The profit shown is gross profit — net sales minus cost of goods sold — before the 280E restriction that makes most operating expenses non-deductible. Your after-tax profit is materially lower, which is why COGS-versus-operating-expense separation belongs in your reporting.
Roughly 45–55% is typical, with limited-license markets often reaching the high 50s to low 60s and mature open-license markets running 40–48%. Use your own Cost-to-Net ratio in Sales Closing as the baseline and watch the trend, not a single day.
The takeaway
Your Dutchie reports aren’t wrong — they’re narrow. They close the day accurately and stop exactly where the interesting questions begin: the rate behind the dollars, the trend behind the snapshot, the consolidated picture behind each store’s silo, and the real profit behind the 280E wall. Reading them well means knowing which columns to trust, which to recompute, and which the report will never show you.
The durable fix is to keep Dutchie for what it’s great at and move your analysis onto a warehouse built for it. CannaHub turns the numbers you already collect into reporting that answers why — so the leak shows up while you can still fix it, not in next quarter’s tax bill.