
Multi-Location Dispensary Reporting: One Dashboard vs. Ten Spreadsheets
Ten spreadsheets isn’t your reporting problem — ten definitions is. Roll up inconsistent store data into a single dashboard and you haven’t fixed anything; you’ve built a faster way to be confidently wrong. Multi-location dispensary reporting only works when every store computes the same metric the same way, and that agreement has to happen underneath the dashboard, not on it.
The dashboard is not the fix. That’s the part nobody selling you one will say out loud.
If your ten stores report through ten spreadsheets, the obvious move is to consolidate them into one view. But the spreadsheets aren’t the disease — they’re the symptom. Store 4 counts a delivery order as a transaction; Store 7 doesn’t. One market books excise tax in gross revenue; the next books it net. Two locations define “discount” differently because their POS platforms do. Stack those in a single interface and you get a number that’s fast, clean, executive-ready, and wrong — with none of the healthy skepticism a messy spreadsheet at least earns.
So the useful question isn’t “how do I see all my stores in one place.” It’s “what would have to be true for a cross-store comparison to mean anything.” Same-store sales answers that, and it’s the spine of this post — because it’s the number that refuses to work until your definitions actually agree.
What same-store sales is, and why it beats revenue by location
Same-store sales — comp sales, comps, like-for-like — measures growth only at locations that were open and operating for the full length of both periods being compared. The formula is simple:
Same-Store Sales Growth = ((This Year’s Sales − Last Year’s Sales) ÷ Last Year’s Sales) × 100
The discipline is in the exclusion, not the arithmetic. Stores opened during the current period are out. Closed stores are out. Locations dark for a remodel or a license suspension are out. And critically, a store doesn’t enter the comp base the day it opens — most retailers require a minimum tenure first, commonly 12 full months, though 13, 14, and 18 are all in use. Skip that rule and a store that opened in month ten of your base year will manufacture a spectacular phantom comp out of nothing but a short denominator. Pick a tenure threshold, write it down, and apply it every period.
What’s left is a like-for-like read on whether the business you already had is getting better. Revenue by location can’t do that job, because growth by acquisition and growth by performance look identical on a revenue chart. Retail guidance illustrates the gap plainly: a chain can post 24% total sales growth while comparable-store sales decline 3% — the new doors mask the fact that the existing ones are shrinking. If you opened two dispensaries last year, your revenue is up. That tells you nothing about whether your operators are winning. It’s also among the first numbers a lender, acquirer, or board will ask you to defend, precisely because it separates performance from expansion.
The problem: your stores don’t agree on what a number means
Here’s where multi-store dispensary reporting actually breaks, and it isn’t at the dashboard layer.
Comps requires you to compare this year to last year, at the same stores, on the same definition. Each of those three conditions is a data problem before it’s a reporting problem.
Same definition means net revenue is calculated identically in every market — same treatment of excise and cannabis taxes, discounts, loyalty redemptions, employee purchases, delivery, returns, and voids. When each state runs a different POS, each platform makes those calls its own way, and the exports don’t announce which convention they used.
Same stores means somebody maintains an authoritative list of which locations qualify as comparable this period and why — including the store that closed for six weeks, the one that relocated across town, and the one that added an adult-use license mid-year. At most operators, that list lives in an analyst’s head.
Same period means one fiscal calendar across markets, with matching week counts. Compare a 4-5-4 retail month to a plain calendar month and you’ll manufacture a comp swing out of nothing but the number of Saturdays.
Putting the exports side by side solves none of it. Agreeing on the definitions once and computing them in a single place does — and that’s a data architecture decision, not a BI tool decision.
Why cross-location comparison is harder in cannabis than in normal retail
In conventional multi-unit retail, the standard answer is to standardize: one POS, one chart of accounts, one calendar, done. In cannabis that answer is structurally blocked, and three conditions make the reporting gap more expensive than it would be elsewhere.
You can’t standardize traceability, because the state chooses for you. Compliance tracking is mandated per jurisdiction, not per operator. Published state-by-state tracking now puts roughly 28 states and territories on Metrc and about 11 on BioTrack, with Pennsylvania and Utah on Leaf Data Systems and Vermont and Washington running systems of their own. Those counts move: New York migrated off BioTrack to Metrc for a Q1 2026 go-live, and Illinois switched in mid-2025. Even the vendor landscape is consolidating — Metrc and BioTrack folded their government contracts into a joint entity in 2025 — but that changes the logo, not the fact that every state runs its own instance on its own API and its own rules. Add a POS ecosystem that varies by market and an acquisition history that brings its own platforms with every license, and system sprawl isn’t a procurement failure. It’s the operating condition.
Your markets are moving in opposite directions, so a blended chain number is noise. For the twelve months ending June 2026, Headset’s retail panel showed New York up 34.2% and Ohio up 26.0%, while Nevada fell 12.3%, Illinois fell 8.9%, and Washington fell 5.8%. An operator in both New York and Nevada reporting one company-wide comp has averaged a boom and a bust into a number that describes neither.
Price compression is decoupling visits from revenue. Over that same period transactions rose 6.5% while the average basket fell 5.5% to $47.29, with packaged flower down 5.7% per gram year over year. A store can grow visits and shrink dollars simultaneously. On a revenue report it looks flat and gets ignored — when in fact it has a pricing and attachment problem a revenue line will never surface.
And if you want proof that definitions move numbers more than demand does, Illinois is the case study. When the state moved to Metrc in mid-2025, reported sales began arriving net of discounts rather than at shelf price. Headset restated its Illinois figures by roughly 17–20% for the affected months and revised its history back to 2021. Nothing about consumer behavior changed. A field definition changed, and a state’s market moved a fifth. That is the entire argument of this post, playing out at the scale of a state — and it happens inside your own business every time two stores define a term differently.
The fix: settle the definitions underneath the dashboard
CannaHub is a centralized data warehouse for cannabis operators — it unifies and automates operational, compliance, and financial data across the systems you already run, then serves reports and dashboards on top. The order of those two things is the whole point. The warehouse is what makes the dashboard trustworthy; a dashboard without one is just your ten spreadsheets rendered in a nicer font.
For multi-location reporting specifically:
- One metric definition, applied everywhere. Net revenue, transaction, basket, and discount are defined once and computed identically for every store, whichever POS the data came from.
- The comparable-store list becomes governed data, not tribal knowledge — open dates, closures, remodels, and license changes recorded, so comps are reproducible when a lender or buyer asks how you derived them.
- One fiscal calendar across every market, so period-over-period movement reflects the business rather than the number of weekends in the month.
- Metrc and other traceability data are first-class inputs, so the compliance record and the retail record reconcile against each other instead of living in two browser tabs.
- New locations onboard into the model, not into a new tab — acquiring a store on an unfamiliar POS becomes a mapping exercise that happens once.
- Reporting runs on a schedule. Comps by store by market becomes a standing view your team reads, not a deliverable someone assembles on the third Tuesday.
You still get one dashboard. The difference is that this one is right.
What it looks like
A useful cross-location dispensary comparison puts each store’s comp next to the movement in its own market, and decomposes that comp into traffic and basket — because those two failure modes need opposite responses. It also forces you to check what the benchmark itself is measuring, as the first row below shows.
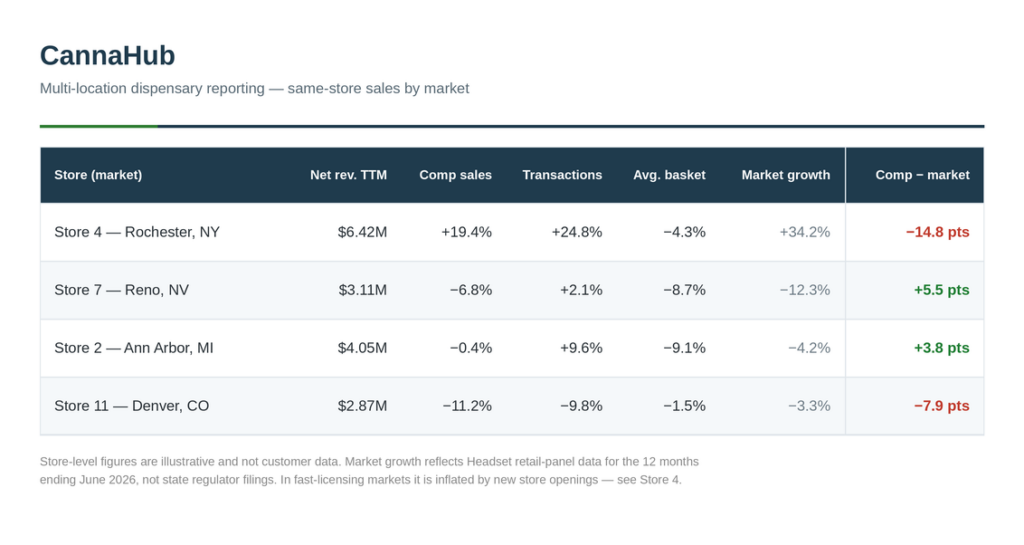
The comp column and the last column disagree on three of these four rows. That alone should tell you a single number per store isn’t a diagnosis. But the last column has a catch of its own, and it’s worth walking through, because it’s the most common mistake in cross-market reporting.
Store 4 looks like a −14.8 point failure. It probably isn’t. Nearly 20% comp growth is the best number on the page, and the market column appears to demolish it: New York grew 34.2%, so the store must be losing share. Except New York’s licensed dispensary count roughly doubled during that window. Almost all of that 34.2% is new doors opening, not existing stores improving — which means you’ve just compared a same-store number to a total-market number. That is precisely the apples-to-oranges error this post opened with, committed one column to the right. Measured per door, New York was likely flat or contracting, and Store 4 is outperforming. The lesson isn’t about Store 4. It’s that your benchmark needs a definition check too, and almost nobody applies one.
Store 7 is the trap inverted, and here the comparison holds. A −6.8% comp reads as failure and draws scrutiny and budget cuts. But Nevada’s store count is essentially flat under capped licensing, so total-market growth there is a reasonable proxy for same-store. Against a market down 12.3%, Store 7 is the strongest operator in the portfolio. Punish it and you’ll teach your best manager to leave.
Store 2 is the one revenue reporting structurally cannot see. Comps are flat, so nothing flags. Underneath, transactions are up 9.6% and basket is down 9.1% — more visits at meaningfully lower spend per visit. That’s a pricing or attachment problem, fixable this quarter if you know about it. (Whether those are new customers or the same customers coming more often is a different question again, and answering it needs loyalty data most POS exports don’t carry — one more thing that has to live in the warehouse.)
Store 11 is the real emergency. Its comp trails its market by 7.9 points, and the shortfall is traffic, not basket. That’s a demand problem no promotion will paper over.
Four stores, four diagnoses, one metric — and one benchmark that had to be interrogated before it could be trusted. The comp starts the conversation. Its decomposition into traffic and basket points at the fix. And the market comparison is only as good as the definition sitting underneath it.
The same report at each altitude
If you’re the CFO or COO of a multi-market operator, comps by store by market is how you separate performance from expansion, defend a growth story to a lender or acquirer, and decide where the next dollar of capital goes. It’s also the number you’ll be asked to reproduce under diligence — a bad moment to discover it lived in a spreadsheet with an undocumented definition.
If you’re a district or store manager, the same number answers a smaller, more urgent question: am I actually getting better, or just riding my market? Traffic versus basket tells you which lever to pull this week. A traffic shortfall is marketing, hours, and menu visibility; a basket shortfall is pricing, assortment, and upsell training. They aren’t interchangeable, and revenue alone won’t tell you which one you have.
Same metric, different altitude — which is exactly why it’s worth computing once, correctly, for everyone.
Frequently asked questions
Lorem ipsum dolor sit amet, consectetur adipiscing elit. Ut elit tellus, luctus nec ullamcorper mattis, pulvinar dapibus leo.
It’s year-over-year sales growth at only those locations open and operating for the full length of both periods compared. New stores, closed stores, and locations dark for a remodel or license issue are excluded, and stores typically must clear a minimum tenure — commonly 12 months — before entering the comp base. Those exclusions are what make it a like-for-like read on operating performance rather than a measure of how many doors you opened.
Subtract last year’s sales from this year’s sales at comparable locations, divide by last year’s sales, multiply by 100. The arithmetic is trivial; the work is agreeing on which stores qualify, which revenue definition applies, and which fiscal calendar you’re using — then holding all three constant across every market.
Because consolidation doesn’t reconcile definitions. If two stores calculate net revenue, discounts, or delivery transactions differently, stacking their exports produces an internally inconsistent total — and a dashboard presents it with more authority than a spreadsheet does. The definitions have to be settled in a data layer beneath the visualization.
Start with comp sales, transaction count, and average basket, because those three decompose growth into its causes. Then layer in inventory turnover, discount rate, shrinkage, margin by category, and revenue per labor hour. The requirement is identical for all of them: one definition, applied the same way at every location.
Because operators can’t standardize onto a single stack. Traceability systems are mandated by state — Metrc in most markets, BioTrack, Leaf Data Systems, or a state-run system elsewhere — and POS platforms usually vary by market and by acquisition. Normal retail solves cross-location reporting by consolidating systems; cannabis has to solve it by unifying data across systems that will never be the same.
Only after you check what the market figure measures. Published state growth is usually total market sales, which in a fast-licensing market like New York is driven mostly by new dispensaries opening rather than existing ones improving. Comparing your same-store number to that inflates the gap and can invert the conclusion. In mature markets with stable store counts the comparison is reasonable; in expanding ones, adjust for license growth or the benchmark will mislead you.
Monthly is the common cadence, and it’s a lagging view. If the data is automated instead of assembled, weekly comps by store give you enough runway to correct a pricing or traffic problem inside the quarter it appeared — rather than confirming it after it’s cost you a season.
The takeaway
Multi-location reporting isn’t a visualization problem. Every month your team hand-assembles store exports, the cost isn’t only analyst hours — it’s that the resulting number carries an unstated set of inconsistent definitions, and the more polished the dashboard, the less anyone questions it. Same-store sales is just the metric that exposes this fastest, because it can’t be computed at all until the definitions agree.
The fix isn’t a better BI tool, and it isn’t a consolidation project that stalls the moment you close on your next license. It’s a warehouse underneath the backends you already run, where every store’s data lands on one definition, one calendar, and one comparable-store list. That’s what turns ten spreadsheets into one dashboard you can actually put in front of a board.