
Dispensary Profit Margin Tracking: The Metrics That Move the Needle
In short Your POS reports gross margin by store. Dispensary profit margin is what’s left after each store pays its people, its rent and its utilities, and those costs live in payroll and accounting, not the register. Join the three into a four-wall view and your store rankings can flip. Put EMA on top and the report tells you which store moved, and why, before anyone goes looking.
The store with the biggest baskets in your company can be the one losing money.
Most dispensary dashboards stop at gross margin because that’s where the POS stops. The register knows the price, the discount and the cost on the product record. It doesn’t know what the budtenders were paid, what the lease costs or what the power bill was. Those numbers sit in payroll and accounting, and they decide whether a store earns its keep.
This post walks through the metrics in the order they turn into profit, names the system that holds each one, and reads a four-store example where the chain looks healthy and one store doesn’t. The spine is one number: dispensary profit margin measured at the store, after the costs the store controls.
What dispensary profit margin means at the store level
A dispensary P&L has three margins, and each one answers a different question.
Gross margin is net sales minus cost of goods sold, divided by net sales. It tells you whether you bought and priced well, and it’s the margin your POS reports.
Four-wall margin keeps going. It also subtracts the costs that happen inside the store: labor, rent, utilities and the other bills with the store’s name on them. What’s left is four-wall EBITDA. Divide it by net sales and you have the margin.
Four-wall EBITDA = gross profit − store labor − rent − utilities − other store costs
Net margin is the company number, after corporate overhead, interest and taxes.
Four-wall margin is the one to run stores on. Gross margin leaves out the biggest costs a store controls. Net margin buries every store under overhead it doesn’t. Four-wall margin judges each store on its own costs, measured the same way.
If you make your own product, the cost line needs work before any of this holds. We covered that in Cannabis COGS: Where Manufacturers Lose Margin.
The metrics that move dispensary profit, in order
Profit gets built in a sequence, from the front door to the lease. Each step has a metric, and each metric lives in one system.
- Traffic: customers, new customers and transactions. From the POS. How many people came in, and how many were new.
- Basket: items per transaction and average cart value. From the POS. What each visit was worth.
- Price: discount rate and returns. From the POS. Discount rate is discounts divided by gross sales, the share of the sticker price you gave back to make the sale. If you run Dutchie, here’s where both numbers live.
- Product margin: gross profit and gross margin. From the POS cost field for outside brands, and from accounting and production records for your own.
- Labor: store wages and labor as a share of net sales. From payroll. For the shift-by-shift view, see sales per labor hour.
- Occupancy and the rest: rent, utilities and other store costs. From accounting, by location.
- Four-wall EBITDA and four-wall margin. From all three, joined.
The first four are where most dispensary KPI dashboards end. The last three decide whether a store makes money. A manager controls some of them and not others. Traffic, discount depth and scheduled hours belong to the store. The lease doesn’t.
Why your POS can’t track profit margin by store
The math in a four-wall report is subtraction. The work is getting three systems to agree on what a store is.
Each system names the store differently. The POS has a location. Payroll has a cost center or a home store for each employee. Accounting has a class, a location or a department, depending on how your chart of accounts was built. Until those map to one store, the numbers can’t share a row.
Payroll charges people to a home store. A manager who covers three shifts at another location gets paid from her own store’s labor line unless someone codes the time. The store she covered looks cheap to run, and hers looks expensive.
The three systems keep different calendars. The POS closes every night. Payroll posts every pay period. The general ledger closes once a month. A month-to-date four-wall view needs labor accrued from hours worked and fixed costs spread across the days, or every store looks profitable until payroll posts.
So the four-wall report gets built in a spreadsheet after close, weeks after the month it describes, and the decisions it should have informed are already made. If your stores also define their metrics differently, start with multi-location dispensary reporting.
Why store-level profit matters more for dispensaries
Product margin is shrinking. Price compression is squeezing gross margin. Green Thumb Industries reported a fourth-quarter 2025 gross margin of 45.4%, down from 53.7% a year earlier, and said price compression drove most of the decline. When product margin falls, the costs below it decide more of the outcome, and those are the costs the POS can’t see.
280E taxes gross profit, not four-wall profit. For adult-use sales, Section 280E still blocks federal deductions for store labor, rent and utilities. Federal taxable income starts close to gross profit, while cash comes from four-wall profit. A store with a thin four-wall margin can add nearly as much to the federal tax bill as your best store and return a fraction of the cash.
Medical sales under a state license came out from under 280E in April 2026. Adult-use sales are still under it. If a store sells to both, the split between them now matters for tax, and it starts in the POS. The FAQ below covers where rescheduling stands.
The fix: one warehouse under the four-wall view
That join is the problem cannahub was built for. Cannahub is a centralized data warehouse for cannabis operators. It brings your POS, payroll, accounting and Metrc data into one place, models it so the fields agree, and runs the reports and dashboards on top. Your systems of record stay where they are.
For dispensary profit margin tracking, that means:
- One store, one record. The POS location, the payroll cost center and the accounting class map to the same store, so every number on a row describes the same building.
- Labor lands on the store. Store hours and wages come in from payroll, whether you run Paragon, Wurk or another provider, next to the sales they supported.
- Occupancy comes from the ledger. Rent, utilities and other store costs come from QuickBooks or Sage Intacct and land on the store they belong to.
- Four periods on one page. Month to date, prior-year month to date, year to date and prior-year year to date, by store and in total.
- Your data, your tools. Power BI, SQL, OData or Excel on our license, priced per system and connector, not per user.
The initial sync takes 48 hours, and first reports arrive by week three. What you get is one row per store, built from the systems that hold the costs instead of a spreadsheet rebuilt after every close.
What a four-wall report shows: one chain, four stores
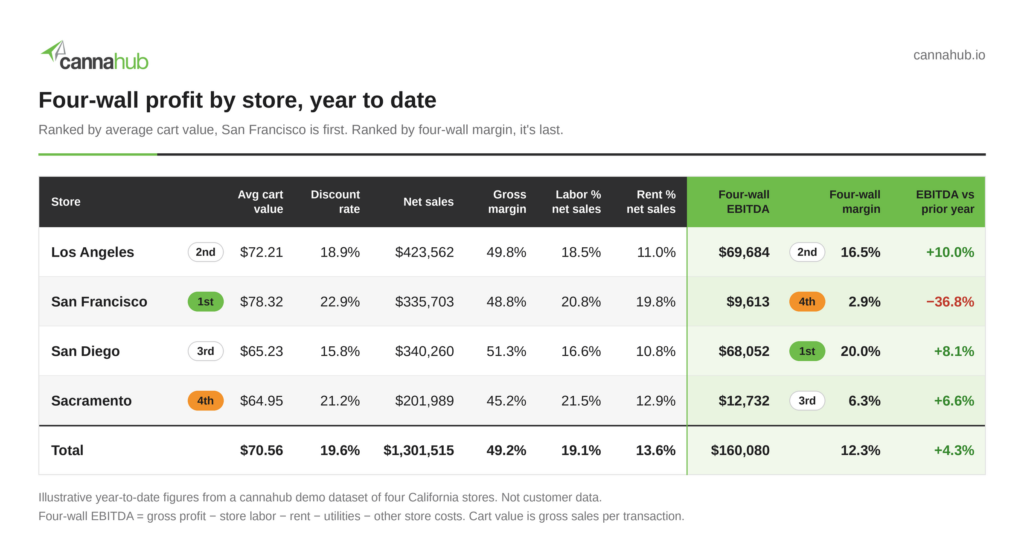
The chain is having a decent year. Four-wall EBITDA is $160,080, up 4.3% on 1.8% more net sales. Nobody would call that a problem.
Now compare San Diego and San Francisco. Their net sales are within $4,557 of each other. San Diego turns its sales into $68,052 of four-wall EBITDA, a 20.0% margin. San Francisco turns its sales into $9,613, or 2.9%.
San Francisco also has the biggest baskets in the company, an average cart of $78.32 against San Diego’s $65.23. Rank the four stores by basket and San Francisco is first. Rank them by four-wall margin and it’s last.
The gap between the two stores is $58,439, and the report shows where it comes from. Rent is $29,700 of it. Labor is $13,423. Gross profit is $10,771, and that piece is discounting: San Francisco rang up $32,553 more than San Diego in gross sales and gave back $36,631 more in discounts, 22.9% of gross sales against 15.8%. Utilities and other costs make up the rest.
If those were adult-use sales under 280E, San Francisco would add 94% as much as San Diego to federal taxable income while producing a seventh of the cash.
The fair objection is that San Francisco rent is San Francisco rent, and nobody needed a report to find that out. True. What the report adds is how much traffic that lease needs. At this year’s margin and labor ratio, each San Francisco transaction leaves $16.64 for rent, utilities and other costs. Winning back 336 of the 407 transactions the store lost against last year would restore last year’s EBITDA.
Let EMA write the report narrative
The full report behind that table holds 380 numbers: four stores and a total, 19 columns, four periods. The reading above came from a small share of them, and finding that share is the work that gets skipped when the week gets busy.
EMA is the chat agent built into cannahub reports. Open the four-wall report and the takeaways, risks and highlights are already written at the top. Ask a follow-up the way you’d ask an analyst and the answer comes back on the page, with the math done and the chart built. Nobody exports anything.
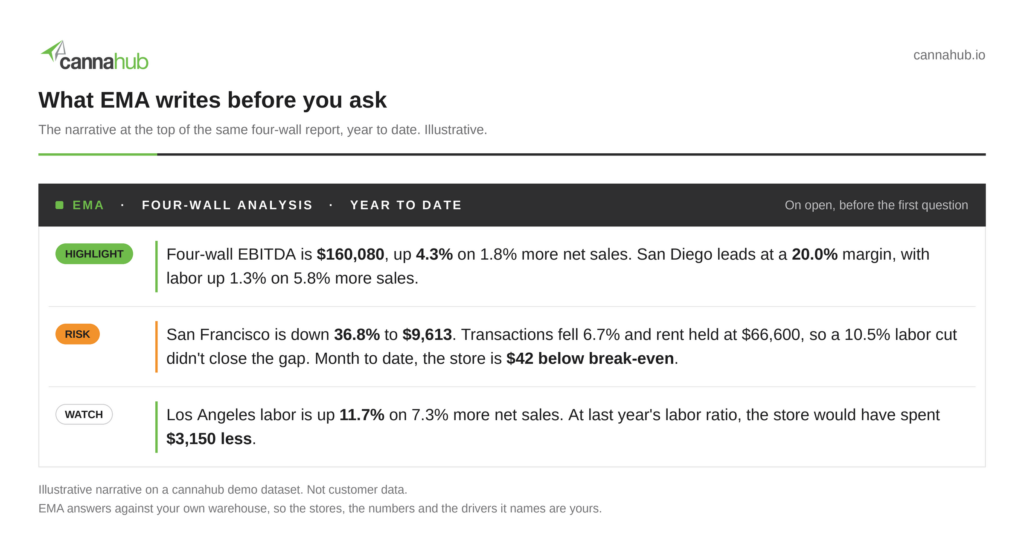
The risk line raises the question a regional manager would ask next, so ask it:
You: How much of San Francisco’s decline is traffic?
EMA: More than all of it. Transactions are down 407, or 6.7%, and store profit per transaction rose from $16.35 to $16.64, so the store earns more on each visit and gets fewer of them. Labor fell faster than sales, from 21.4% to 20.8% of net sales. Rent held at $66,600.
That answer keeps the blame off a manager who did the controllable part right, and it points the conversation at the lease and the traffic, where the money went.
Three things make those answers worth trusting.
It answers from the warehouse, not an export. EMA works from the same warehouse as the report, whether that’s fed by Dutchie, Metrc, LeafLink, Wurk, QuickBooks or Sage Intacct, so it reads the same numbers as the page. An AI pointed at three loose exports would have to guess which payroll cost center is San Francisco.
It’s written for your seat. The controller’s read leads with margin and close risk. Retail gets basket and discount. Ops gets throughput. Same warehouse underneath, a different read on top.
It comes to you. Scheduled email alerts carry the story behind the number, so the San Francisco risk reaches the people who can act on it without anyone opening a dashboard.
If you already pay for OpenAI, Anthropic or Gemini, EMA can run on your key instead of ours. Nothing changes about how it works.
One report, two altitudes
If you’re the owner, CFO or controller, four-wall margin by store is the number behind a lease renewal, a remodel budget, a closure and the price of an acquisition. It tells you which stores fund the company and which ones the company funds.
If you run a store, the same row shows which levers are yours. Traffic, discount depth and scheduled hours move with your decisions. Rent doesn’t, and a four-wall view keeps a manager from getting blamed for a lease.
One row per store, read from the top and from the floor.
Frequently asked questions
Lorem ipsum dolor sit amet, consectetur adipiscing elit. Ut elit tellus, luctus nec ullamcorper mattis, pulvinar dapibus leo.
Published figures put dispensary gross margins in a 45% to 60% band, and net margins anywhere from below zero to about 20%, depending on the market, the number of licenses and how much 280E takes. Ranges that wide are hard to manage against. Your own stores make a better benchmark: rank them by four-wall margin, measured the same way, and work the gap between the best store and the rest.
Start with net sales after discounts and returns. Subtract cost of goods sold to get gross profit, then subtract store labor, rent, utilities and the other costs the store controls. Divide what’s left by net sales. That’s four-wall margin, and leaving corporate overhead out is what makes stores comparable.
Gross margin stops at the cost of the product. Four-wall margin also charges the store for its labor and its space. In the example above, San Francisco’s gross margin trails San Diego’s by 2.5 points. Its four-wall margin trails by 17.1.
The POS for sales, discounts, returns and product cost, payroll for store hours and wages, and accounting for rent, utilities and other store costs. The hard part is the join, because each system names the store differently and runs on its own calendar.
For adult-use sales, yes, as of October 2026. An April 2026 federal order placed state-licensed medical marijuana in Schedule III, which takes 280E off that activity. Adult-use stayed in Schedule I, and the DEA proceeding on broader rescheduling was paused on September 29, 2026 with no completion date. This is general information, not tax advice, so confirm your position with your cannabis CPA.
A written read of what changed and why, at the top of the report when you open it and in scheduled email alerts, plus plain-English answers to follow-up questions. It works from the same warehouse as the report, so it reads the same numbers you see on the page.
The takeaway
Dispensary profit margin isn’t one number. It’s a chain that runs from the front door to the lease, and the POS sees the first half of it. The second half sits in payroll and accounting, which is why most stores get judged on gross margin and most leases never get questioned.
Join the three and the four-wall view shows you which stores fund the company. Put EMA on top and the report says so when you open it, with the driver named.